Kuroto Fund, L.P. - Q2 2023 Letter

Dear Partners and Friends,


PERFORMANCE


Kuroto Fund appreciated +6.5% in the second quarter and gained +9.7% in the first half of 2023.


Visit our performance page to view the Kuroto Fund, L.P. fund summary in more detail.


Generating returns in good and bad markets

Kuroto Fund’s 24-year history can clearly be divided into two periods. For the first eight years of the fund, from January 1999 to the peak of October 2007, the MSCI Emerging Markets Index increased more than five-fold and compounded at a 21% annualized rate. Since 2007, the MSCI Emerging Markets Index has compounded at just 0.5% per year. Kuroto Fund outperformed in both periods. During the first period ending in October 2007, Kuroto compounded at an incredible +29.0% per year. Since 2007, Kuroto Fund has compounded at a much more modest +3.9% per year


In the initial eight-year period, our investment successes were straightforward. We bought stocks that appreciated rapidly and then sold them. For instance, we held positions in Namyang Dairy and Dabur for approximately three years during which they increased five-fold in dollar terms on average. Inco Indonesia, even more impressively, rose more than thirty-fold in just over three and a half years. We bought each of these companies at mid-to-low single-digit multiples of free cash flow and sold them at more reasonable multiples on much higher earnings. 


The period from October 2007 to 2023 has been much more challenging.  Over the past almost sixteen years, we had to work hard to generate modest returns. To illustrate how we achieved these returns since 2007, the following letter outlines our buy and sell decisions in four companies that have generated good IRRs and have made the greatest contribution to Kuroto Fund’s performance over that period. 


FPT

-         First bought:  June 2014   /   Current 6% position

-         Dollar contribution: $27.9m of period’s $34.6m   /   Avg. period AUM $181m

-         Fund contribution: +33%

-         Return of stock from initial purchase: +576%

-         Return of fund from initial purchase: +81%

-         IRR based on purchases and sales: +16% 

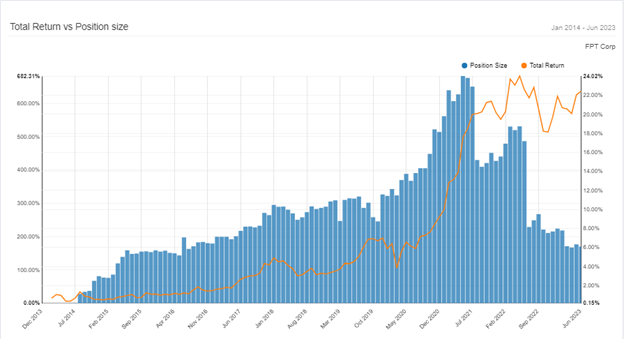
We first purchased shares in FPT in 2014.  At the time, FPT was a Vietnamese conglomerate with several business lines that didn’t fit together: the third largest local broadband cable company; the second largest cell phone retailer; an IT distribution company; and a small but quickly growing tech outsourcing business focused on Japan.  While we were skeptical about the quality of some of FPT’s businesses, nevertheless we believed that FPT had a real competitive advantage as the only private broadband company in Vietnam.  The meritocratic culture at FPT in which young people could join and rise through the ranks without connections struck us as obviously superior to the incentive structure at the company’s state-run competitors. 


To our delight, FPT has outperformed our most optimistic expectations. Dr. Binh, the company’s controlling shareholder, turned out to be an excellent entrepreneur.  He sold majority stakes in FPT’s two, low-quality businesses: the cell phone retailer and the technology distribution business.  The broadband business, after a period of heavy investment, has compounded revenue at double digits and seen margin improvement, allowing earnings to grow faster than our expectations.  But the real surprise has been the success of the education and global technology businesses. 


Leveraging FPT’s brand as the country’s best place to work in technology, the company created FPT University, which has become one of Vietnam’s premier technology education institutions and presently enrolls over 100k students.  This business is highly profitable and a meaningful contributor to the bottom line.  Moreover, this business has provided a steady flow of new graduates for the global technology-outsourcing business.  FPT’s global technology-outsourcing business has grown into the group’s biggest business by far.  The business line has expanded from Japan to have a large presence in the U.S., Europe, and the rest of Asia.  And, it has moved up the value chain from very low-end technology outsourcing to higher-end digital-transformation services.  FPT now owns the country’s largest and most impressive technology ecosystem and is in a stronger position to grow today than it was when we initially invested. 


As the chart above shows, we allowed the position size grow to over 20% of the fund, only meaningfully reducing the position as the opportunity to invest in extremely undervalued oil and gas businesses presented itself last year.  Today, FPT is 6% of our fund.  It trades at a mid-teens earnings multiple and is still growing earnings around 20% per year. Our investment success in FPT is proof that a strong corporate culture can help an organization overcome serious challenges and generate value for long-term shareholders. 


LOGO YAZILIM

-         First bought: August 2018   /   Current 2.4% position

-         Dollar contribution: $9.6m of period’s $17.1m   /   Avg. period AUM $86m

-         Fund contribution: +15%

-         Return of stock from initial purchase: +67%

-         Return of fund from initial purchase: +61%

-         IRR based on purchases and sales: +47% 

We purchased shares of Logo Yazilim in the summer of 2018 as the Turkish lira was in freefall and the U.S. government was threatening to destroy the Turkish economy with sanctions over the imprisonment of Pastor Andrew Brunson. We had been following Logo since 2014, had spoken to management several times, and had identified it as a business that we would love to own at the right price.  The summer of 2018 delivered that price.


Logo was and remains the dominant enterprise resource planning (ERP) software company in Turkey for small-and-medium-sized businesses.  By 2018, the company was well-positioned to navigate Turkey’s periodic macroeconomic and geopolitical storms and thrive in a more benign environment.  Logo’s customers face enormous switching costs, so the company had the ability to increase prices in-line with inflation after a modest lag.  In addition, ERP was very underpenetrated throughout the country, so the growth opportunity was large.  Moreover, the company had little debt and traded at just 8x forward earnings estimates.  Because of the high equity-market volatility caused by the crisis, we were able to buy over 5% of the company in a short amount of time and became one of the largest shareholders outside of the founder.


As Turkey’s 2018 crisis progressed and ultimately passed, Logo not only survived, but thrived.  The ERP business grew substantially, its Romanian subsidiary turned profitable and became a meaningful contributor, and the company took advantage of a regulation change to ramp up a tax compliance software business that has grown from nothing to over 20% of the top line.  By 2021, the market understood the quality of the business, and the shares re-rated to over 20x earnings.  As a result, we reduced our position from a high of 17% of the fund to around 6%. 


In 2022, the USD value of Logo’s shares declined significantly again as the stock was punished by a combination of the lira’s decline and a stock market derating as foreign investors fled the Turkish equity market.  We increased our position as the shares declined, believing that we could again generate good returns owning Logo.  This investment thesis worked for a while but we decided to sell most of our position in early 2023 as it became apparent that Turkey’s latest economic difficulties weren’t going to recede quickly.   


Today, Logo’s shares have derated to 10x earnings.  The business remains very resilient and the opportunity for growth in a better economic environment remains, but the company fundamentals are hard to forecast because of the macroeconomic environment in Turkey.  With the political situation clarified, and Erdogan beginning to implement a more orthodox economic team, there is reason for hope.  At the moment, we are waiting for a bit more clarity before adding to our Logo position.  Today, Logo is a 2% position in our fund.  Our successful investment in Logo reminds us of the importance of maintaining a buy list of well-researched businesses in case the opportunity presents itself. 
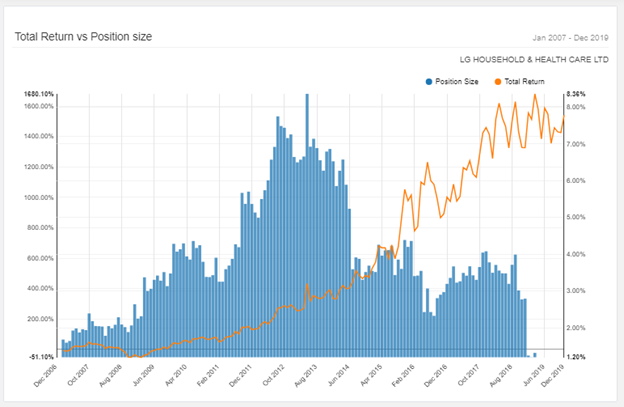

LG H&H

Metrics from inception of accounting system in 2007

-         First bought: June 2003   /   Last sold: March 2019

-         Dollar contribution: $42.1m of period’s $226.4m   /   Avg. period AUM $337m

-         Fund contribution: +14%

-         Return of stock from 2007: +1680%

-         Return of fund from 2007: +1205%

-         IRR based on purchases and sales: +22% 

LG H&H is an early vintage investment that we initially bought in June of 2003 and held through the Global Financial Crisis of 2008.  After the Asian Crisis in the late 1990s, LG H&H had struggled with declining market share in their door-to-door cosmetics business, and the management team was not sure how to improve the company’s margins on its household branded products business.  On top of these problems, LG H&H had a leveraged balance sheet following an acquisition spree in the mid-1990s. 


The silver lining to all these problems was that the LG group parent company had recently hired an experienced Proctor & Gamble executive to be the new CEO of LG H&H and granted him relatively large amounts of autonomy within the LG chaebol.  This meant that as minority shareholders we would benefit from Western style capital allocation and business rationalization at LG H&H.  Furthermore, we were able to buy LG H&H preferred shares at a meaningful discount to the common shares even though they had the same economic characteristics.  This was a quirk of the Korean market that allowed us to hold onto the shares for over a decade with a high margin of safety even as LG H&H’s common shares traded at a valuation that was close to fair value.


The turnaround of LG H&H worked much better than we expected.  Management was able to stabilize the company’s market share in its high margin cosmetics business and turned around its home care product line.  They rationalized SKUs and focused on the 20% of the brands that generated 80% of the profit.  As a result, the company more than doubled margins, meaningfully grew the top line, and deleveraged its balance sheet.  The company then launched an aggressive growth strategy in China that was incredibly successful.


The stock we bought re-rated from a mid-single-digit earnings multiple to a mid-teens multiple as LG H&H transformed into an easier to understand, high return on capital branded products business with a pristine balance sheet and a proven management team.  The CEO from Procter & Gamble retired in 2014, and we continued to own the business until fully exiting in 2019 at what we believed was a full valuation.


Since our sale, LG H&H’s China business has collapsed and the company has struggled with COVID lockdowns, regulation, and poor brand mismanagement.  The stock retraced back to where it was trading over a decade ago.  While the current valuation is not demanding, the outlook is cloudy and the investment case is hard to underwrite.  This result underlines to us the value-investing fundamentals of staying on top of a company’s competitive advantage, buying with a meaningful margin of safety, and selling when that margin of safety disappears.


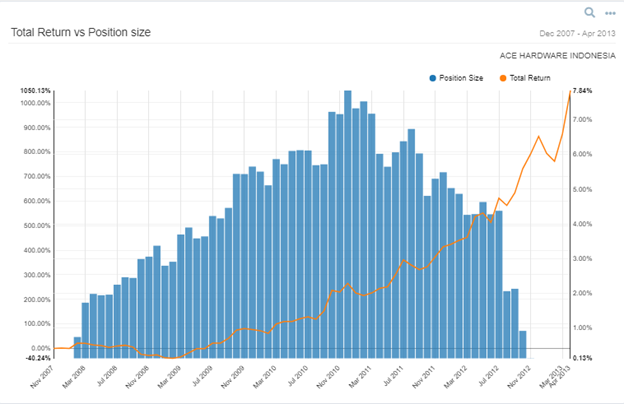
ACE HARDWARE INDONESIA

-         First bought: February 2008   /   Last sold: November 2012

-         Dollar contribution: $34.1m of period’s $335.1m   /   Avg. period AUM $342m

-         Fund contribution: +11%

-         Return of stock from initial purchase: +792%

-         Return of fund from initial purchase: +78%

-         IRR based on purchases and sales: +45% 

We bought ACE Hardware in Indonesia at a discounted valuation during the Global Financial Crisis of 2008. We liked the business’s strong balance sheet, high margins, and low valuation.  Additionally, we felt that they had the special sauce of how to do retail in Indonesia.  While the company was a licensee of the U.S. ACE hardware brand, they had changed their merchandising to fit Indonesian tastes.  Instead of selling hammers and nails, the company was selling a high-margin product mix that included everything from children’s toys to fish aquariums.  Although the product mix didn’t make much sense from an American perspective, it worked well in the Indonesian context.  The company was rapidly growing both square footage as well as same-store sales.  The result was a fast-growing company that spun off cash.


We had reservations about the durability of the margins, the sustained lack of competition, and serious concerns about a related-party distributor that was controlled by the family that also controlled Ace Hardware Indonesia.  After digging deeper and conducting diligence on the controlling family, we were able to build conviction that the family was operating in an ethical—if not Western—fashion, and that the margins reflected the unique merchandising strategy of ACE that other brick and mortar retailers in Indonesia would find hard to replicate.


Over the course of our five-year holding period, the shares increased almost 9-fold.  When the shares reached what we saw as a fair valuation and the Indonesia rupiah became relatively strong, we elected to exit.  Now nine years after our exit, the shares are trading 30% below the price we achieved in our last sale.  The company’s deteriorating fundamentals were largely driven by an increase in competition at the high end from IKEA and at the low end from an aggressive Malaysia low-priced brand.  Additionally, online retail expanded rapidly in Indonesia.  Ace’s growth has slowed dramatically and our concerns about the sustainability of its incredibly high margins are now shared by the market—it just took 15 years for the competitive dynamic that concerned us to play out.  Our investment in Ace Hardware Indonesia highlights the importance of keeping a close eye on an investment’s competitive position and exiting a position when the margin of safety goes away.


Sincerely,


Sean Fieler  Brad Virbitsky

end notes

[1] Please note that estimated performance has yet to be audited and is subject to revision. Performance figures constitute confidential information and must not be disclosed to third parties. An investor’s performance may differ based on timing of contributions, withdrawals and participation in new issues.


Unless otherwise noted, all company-specific data derived from internal analysis, company presentations, Bloomberg, FactSet or independent sources. Values as of 6.30.23, unless otherwise noted.


This document is not an offer to sell or the solicitation of an offer to buy interests in any product and is being provided for informational purposes only and should not be relied upon as legal, tax or investment advice. An offering of interests will be made only by means of a confidential private offering memorandum and only to qualified investors in jurisdictions where permitted by law.


An investment is speculative and involves a high degree of risk. There is no secondary market for the investor’s interests and none is expected to develop and there may be restrictions on transferring interests. The Investment Advisor has total trading authority. Performance results are net of fees and expenses and reflect the reinvestment of dividends, interest and other earnings.


Prior performance is not necessarily indicative of future results. Any investment in a fund involves the risk of loss. Performance can be volatile and an investor could lose all or a substantial portion of his or her investment.


The information presented herein is current only as of the particular dates specified for such information, and is subject to change in future periods without notice.

By Kieran Brennan April 8, 2025
Webinar Replay of Case Study presentation on Solidcore Resources
By Kieran Brennan February 26, 2025
Payne Points of Wealth Podcast - "The revenge of Inflation and Kazakhstan"
By Kieran Brennan January 18, 2025
Dear Partners and Friends, PERFORMANCE Equinox Partners Precious Metals Fund, L.P. fell -12.9% in the fourth quarter, finishing the year down – 2.9%. The fund’s performance reflects the lackluster performance of the gold mining sector as well as the underperformance of the companies we own. While there were some clear themes, such as producing companies outperforming exploration companies, our 2024 results are most accurately captured through a description of our six best and six worst performing investments during the year. These twelve companies capture every investment that contributed at least 1%, positive or negative, to our 2024 fund performance. A Challenging Year In 2024, the gold price finished up +27.4%. The GDXJ ETF which tracks the index of junior gold mining producers was up +15.7%. Our portfolio of miners in this fund was down -2.9%. The underperformance of the gold miners as compared to gold largely reflects government participation in the gold market. In 2024, governments bought gold, not gold miners. The poor performance of the gold miners also reflects the sector’s continued subpar returns on capital. The S&P TSX Global Gold universe, a group of large, mature gold miners, only generated an 11% ROE in 2024 and a 5.4% free cash flow yield according to RBC. Despite their inadequate returns on capital, producing miners handily outperformed most exploration and development companies. There remains almost no market for most gold mining companies that are years away from first production. As value investors with contrarian instincts, we have found the increasingly irrational valuations of the pre-revenue companies of particular interest. Often as a project advances, the equity market value of the company declines. These share price declines in turn create a self-reinforcing dynamic in which the small, cash-starved companies underperform because they don’t have access to the capital necessary to move their projects forward. At this point, the downward spiral of pre-revenue gold miners is very extended and nearing a floor in our opinion. Not only are the valuations of these companies incredibly low, but these companies have become increasingly attractive acquisition targets. Although exploration companies are the most severely discounted sector, 54% of our fund remains invested in producing companies. In general, our producing companies trade at a discount to the sector because they are executing on significant capex plans and lack free cash flow. During construction periods, the market can become excessively skeptical. This skepticism, in turn, can present an opportunity to buy high quality assets run by good management teams at attractive valuations. We believe that this is clearly the case at Eldorado Gold, K92 Mining, West African Resources and Adriatic Metals. Overall, our miners are incredibly cheap. Assuming a flat gold price, we estimate our producers will generate a 23.5% IRR. Our companies that do not yet generate any cash flow are cheaper still. Ascot, Thesis, Troilus and Goldquest, for example, have an average IRR of over 30% at current metals prices. Six Winners and Six Losers in 2024 Note: Below IRR is our Equinox internally calculated IRR based on 2024 year-end market prices and forecasted future FCF per share to equity. Borealis Mining: 2024 Performance +29%, IRR 48% Borealis was founded by Kelly Malcolm in 2023 to leverage a large heap leach facility in Nevada by acquiring nearby low-grade heap leach assets. We invested in a pre-IPO round at a $30M post-money valuation. At the time, Borealis had approx. $5M worth of crushed stockpiles, a fully permitted heap leach facility, ~60,000oz of reserves ready to be processed with limited capex and substantial exploration potential at depth. In late 2024, Borealis began to acquire nearby deposits. Borealis purchased Bull Run for $6M in cash. This translates to $14 per ounce for ~500,000oz of already defined resources, and confirms managements intuition that there are small, stranded assets for sale in Nevada. We expect Borealis to continue this acquisition strategy and ramp to become a ~75,000 oz per year producer. K92 Mining: 2024 Performance +22%, IRR 17% K92 controls the world-class Kainantu mine in the highlands of Papua New Guinea. This mine is a high-grade, low-cost asset with a 3 million oz resource at 7g/t. K92 produced 120,000 oz last year, and we expect the company’s Phase 3 expansion will take annual production to over 150,000 oz (gold equivalent) in 2025. While K92 has often struggled to meet its ambitious growth targets, the company has strung together two consecutive quarters of meaningfully higher production with higher than reserve grades. K92 recently expanded the milling capacity which had been a meaningful bottleneck for years. If the company can reach Phase 4, the Kainantu mine’s production will produce ~400,000 oz at a bottom quartile cash cost of <$1000/oz while maintaining a clean balance sheet with minimal leverage. West African Resources: 2024 Performance +38%, IRR 31% In 2024, West African Resources (WAF) remained on-time and on budget in the build of the company’s second mine in Burkina Faso, called Kiaka. Once Kiaka is commissioned in Q3 2025, WAF will be a ~450,000 oz annual producer for the next 10 years. While the construction has proceeded as expected, WAF was adversely impacted by the local content language in Burkina Faso’s new mining code. Rather than pay the resulting mark up in their rental of local equipment, WAF elected to purchase their mining fleet outright. This decision added $150 million to the company’s capital budget and resulted in a July equity raise of the same amount. While we were disappointed with the need for more equity capital, ultimately the raise will accelerate WAF’s buy-back and dividend plans. If the company continues to trade at the current valuation, we expect the board will announce a sizable share repurchase as soon as the company’s debt is repaid. Hochschild Mining: 2024 Performance +96%, IRR 18% Hochschild Mining (HOC) is a proven mine builder with the strategy of reinvesting free cash flow into new projects to grow production. In 2024, we visited their newly commissioned mine in Brazil, called Mara Rosa, which was successfully built on time and on budget. Mara Rosa will deliver a 20%+ project level IRR and highlights HOC's competence in executing medium-size projects in Latin America. We expect the company will be able to repeat this success with another mine in Brazil, the Monte Do Carmo project in the neighboring state of Tocantins. Big picture, HOC is a family-owned business with a goal of producing 500,000 ounces of gold per year by 2030. While we would prefer a return on capital goal rather than a growth target, we appreciate the straight-forward way the company organizes its operations, and we believe the company will not undertake projects with less than a 20% cash on cash IRR. Moreover, unlike many growth miners, when the company reaches their targeted 500,000 ounces of annual production – anticipated for 2030 - we expect HOC to transition to return free cash flow to shareholders. Galiano Gold: 2024 Performance +35%, IRR 29% Galiano has been busily working on a new mine plan which will be released on January 28th. We expect the company’s production guidance will increase as Galiano elects to move forward with the redevelopment of their higher grade Nkran pit. We also expect increased exploration spending in 2025 as the company ramps up work on their newly consolidated land package. We are expecting Galiano to guide to a production target of approx. 250,000 ounces per year by 2027. Even at this higher rate of production, we anticipate the company will be able to more than replace reserves given the prospectivity of the Asankrangwa gold belt in which they operate. While Galiano will have to reinvest the vast majority of its cash flow in growth in 2025 and 2026, the company should become a substantial free cash flow generator beginning in 2027. Solidcore Resources: 2024 Performance +22%, IRR 21% Solidcore, a spin-out from Polymetal, is a new position in our fund. Solidcore is run by CEO Vitaly Nesis, and controlled by Oman’s sovereign wealth fund. The company operates two long-lived mines in Kazakhstan and produces 480,000 ounces of gold annually at a competitive All-In Sustaining Cost (AISC) of $1,300/oz. With an EV/EBITDA multiple of 2.2x, Solidcore trades at an almost 50% discount to its peers. This undervaluation is largely due to the company’s sole listing on the Astana International Exchange in Kazakhstan. We expect Solidcore to generate roughly $400 million in free cash flow per year at current gold prices. In 2025 and 2026, this free cash flow will be invested in a new pressure oxidation autoclave. Beginning in 2027, we anticipate that $100 million USD of the company’s free cash flow will be distributed to shareholders. This prospective dividend along with the company’s plan to re-list on the London Stock Exchange offers two catalysts that should drive a significant re-rating. Orezone Gold: 2024 Performance -30%, IRR 27% While Orezone completed its initial build on time and on budget, the company failed to generate the free cash flow necessary to internally finance the expansion of its operations in Burkina Faso. The company’s reliance on high-cost diesel generators and an unreliable power grid proved particularly problematic. Largely due to higher-than-expected power costs, the midpoint of their AISC guidance increased by $100/oz from last year’s projection of $1,338/oz. Despite the elevated power costs, Orezone successfully closed their financing for the hard rock processing plant in December 2024. This financing will enable Orezone to increase annual production from approx. 120,000 oz in 2024 to ~180,000 oz in 2026. We expect 2025 to be a pivotal year for the company as they will begin to generate sufficient cash to pay down debt and continue building towards their 250,000 oz/year target. We are also encouraged by the company’s ongoing exploration program which has the potential to increase the Bombore’s mine life at higher grades. C3 Metals: 2024 Performance -62% C3 stock declined significantly in 2024 even as the company made significant progress advancing their projects in both Jamaica and Peru. With respect to their Jamaican asset, C3 Metals signed a joint venture agreement with the Stewart family, one of the wealthiest families on the island. C3 is now well-positioned to do a JV deal with a larger international mining company that can finance the costly deep holes necessary to test the porphyry copper deposit’s potential. In Peru, C3 Metals received a permit to access one of its land packages located just 40 kilometers east of MMG’s Las Bambas mine. This permit, which took years to secure, opens the door for further exploration in a proven copper-rich region. With the permit in hand, C3 Metals should be able to bring in a larger partner to drill out the asset. Troilus Gold: 2024 Performance -45%, IRR 35% In May 2024, Troilus submitted its feasibility study to the Canadian government. This new study detailed their plan to develop a 22-year open pit mine that would produce approx. 300,000 oz of gold per year. With current gold prices north of $2,600 and copper hovering around $4, the project will likely move forward. The company has received financial support from a handful of export credit agencies interested in its 10% copper production. Troilus is also in the final stages of submitting the Environmental and Social Impact Assessment (“ESIA”), another key milestone as they advance towards construction. Located 300 kilometers north of Chibougamau, Quebec, the Troilus project is a brownfield site in a favorable mining jurisdiction with the potential to become a Top 10 copper gold project in Canada. We are fans of CEO Justin Reid and believe in his ability to permit the project and advance it towards becoming a premier North American copper-gold producer. At a $4/oz equity market cap to gold equivalent ounces in ground ratio, we believe Troilus is one of Canada’s best leveraged investments to rising gold and copper prices. Ascot Resources: 2024 Performance -23%, IRR 38% Ascot Resources put its Premier gold project on care & maintenance in September of 2024. At the time, the company didn’t have enough ore coming from the underground mine to profitably operate the 2,500 tonnes per day mill. To rectify the lack of available ore, the company raised $43 million, extended the term of their debt, and decided to invest in an additional 2,500 meters of development before commissioning the mill. The board then made a change at CEO and brought in Jim Currie for his extensive underground mining experience and added our own Coille Van Alphen to the board. Underground development is currently underway, and we expect the mill to restart in Q2 2025. One more injection of capital will likely be required to ensure the company has a sufficient working capital buffer as they restart the mill. When the mine reaches commercial production, it will be able to generate a sustainable ~$100m of FCF per year which should translate into a stock price of at least $1 CAD per share. Great Pacific Gold: 2024 Performance -47% Great Pacific owns two highly prospective gold exploration projects in Papua New Guinea (PNG). Over the course of 2024, the company refined its exploration targets and drilled 5000m at its Kesar project in the highlands of PNG. The Kesar project looks to be an extension of nearby K92’s mine, and as such may be sold to K92. Great Pacific will begin drilling exploration targets at its second PNG property in Q2 of 2025. This property is a brownfield site with past production at a grade of more than 10 g/t. Great Pacific has a third asset in Australia, which we believe could be sold to fund the company’s exploration activities in PNG. Great Pacific is led by an excellent CEO in Greg McCunn. We got to know Greg through a previous investment in West Africa. As CEO, he brings the necessary vision, discipline, and accountability to an exploration company. We believe the company will deliver exploration success at their two PNG assets and ultimately enable Greg to create shareholder value in a variety of ways. GoGold Resources: 2024 Performance -24%, IRR 30% GoGold has been waiting two years for its permit in Mexico. The delay was caused by the previous Mexican President Andres Manual Lopez Obrador’s (AMLO) staunch opposition to new mining development. In the end, while neither of AMLO’s major proposed changes to the mining code passed, few mining permits of any kind were issued during his time in office. GoGold’s large cash buffer and existing heap leach operation enabled the company to wait out AMLO without needing to raise additional equity capital. We think their patience will soon be rewarded as the new administration of President Claudia Sheinbaum plans to process permit applications on their technical merits. In GoGold’s case, the technical merits of their Los Ricos South project are exceptionally strong with over 100 million oz of silver at an average grade of 276 g/t. Sincerely, Equinox Partners Investment Management
By Kieran Brennan January 17, 2025
Dear Partners and Friends, PERFORMANCE Equinox Partners, L.P. declined -6.5% in the fourth quarter of 2024, finishing the calendar year 2024 up +17.7% net of all fees. Our poor performance in the fourth quarter was driven by a sharp selloff in gold and silver miners despite a flat gold price during the period. 2024 Year in Review Crew Energy accounted for 100% of our fund’s performance in 2024. We offered a fulsome write-up of Crew in our third quarter letter and need not repeat the details of the acquisition by Tourmaline here, other than to note that the 72% premium resulted in an ~18% contribution to the fund’s total return. While there was significant movement among our other investments, their aggregate contribution was close to zero. This is a disappointing result given the significant progress many of our companies made last year. The market was not impressed by Paramount Resources’ sale of its core asset to Ovintiv for $3.3bn CAD. Nor did the market seem to care that Kosmos energy finally brought its flagship Tortue asset online in December. Thesis Gold’s positive feasibility study elicited an initial positive reaction, which was quickly reversed. Elsewhere, the market remains totally indifferent to the rapid progress that West African Resources is making at their Kiaka asset. While we understand that our sectors are out of favor, we would hope to see at least some of the value they are creating reflected in their stock prices in 2025. We’ve been busy over the past six months, establishing several sizable, new positions. We sold half of the Tourmaline shares we received in consideration for our Crew shares and used funds to make the following investments: an 11% portfolio weight in Solidcore Resources, an 8% position in Kosmos Energy, a 5% weighting in Ensign Energy, and a 5% weight in Gran Tierra Energy. Solidcore and Kosmos are both top five positions and receive a full writeup in the letter that follows. Ensign Energy is a North American energy service company, and Gran Tierra Energy is an E&P company with assets in Latin America and Canada. Both Ensign and Gran Tierra trade at particularly compelling valuations. investment Thesis Review for our top 5 Long Positions by Weight
By Kieran Brennan January 17, 2025
Dear Partners and Friends, PERFORMANCE Kuroto Fund, L.P. appreciated +6.5% in the fourth quarter of 2024 and finished the year up +11.1%. Performance for the quarter was driven primarily by the positive performance our operating company holdings in Nigeria, Ghana, and Georgia. A breakdown of Kuroto Fund exposures can be found here . 2024 Year in Review Kuroto’s top five investments made large strides last year. Seplat completed its ExxonMobil Nigeria acquisition, more than doubling its production, cash flow and reserves. Georgia Capital successfully sold a non-core asset and is in a good position to buy back a lot of stock this year. MTN Ghana saw strong operational performance while Ghana’s economy and currency stabilized. Guaranty Trust Bank completed a government-mandated equity raise, and Nigeria made steps towards stabilizing its economy. Lastly, Kosmos brought on its long-delayed Tortue LNG project. In each case, we believe the market has not adequately factored in the progress our companies have made, and we anticipate a more fulsome rerating of our top holdings in 2025.
By Kieran Brennan November 1, 2024
Dear Partners and Friends, PERFORMANCE Equinox Partners Precious Metals Fund, L.P. rose +3.1% in the third quarter and is up +11.0% through the end of September 2024. Performance for the quarter was driven primarily by our group of explorers, with additional positive contribution coming from the producing segment of the portfolio. These gains were partially offset by the decline of one of our development stage companies which has experienced delays and raised additional capital. As our gold miners have lagged the indices, a substantial valuation gap has opened between the largest gold miners in the industry and the producing companies we own. At spot pricing, consensus sell-side models have Agnico, Barrick, Kinross and Newmont delivering an IRR of just 3%. Our portfolio of producers, on the other hand, models out to an IRR of 20% using the same metals price assumptions. There's substantial value in the gold mining sector, but the largest companies are not the ones to own.
By Kieran Brennan October 31, 2024
Dear Partners and Friends, PERFORMANCE Kuroto Fund, L.P. declined -0.8% in the third quarter of 2024 and is up +4.2% for the year through September 30 th . Performance for the quarter was driven by a pullback in our energy holdings, which more than offset the gains in MTN Ghana and several of our financials. A breakdown of Kuroto Fund exposures can be found here . Kuroto Fund's Energy Investments Since SUmmer of 2020 Kuroto Fund began adding oil producers to the portfolio in August 2020. Today, we own four oil companies. Cumulatively, our portfolio of oil companies have added $5mn to our P&L, but more than all of this performance has come from one company, Seplat. By our calculation Seplat will be generating a free cash flow yield of ~28% once it consummates the acquisition of Exxon Mobil Nigeria early next year. While our remaining portfolio of oil companies, in aggregate, have yet to contribute positively to our returns, they are executing and delivering strong fundamental progress. One of these portfolio companies we expect will complete an acquisition this month that should increase production by 60%. Two others should bring on long-delayed fields before year-end and we expect all three to release meaningful exploration results over the next six months. 
By Kieran Brennan October 31, 2024
Dear Partners and Friends, PERFORMANCE Equinox Partners, L.P. rose +16.4% in the third quarter of 2024 and is up +25.9% for the year through September 30th. The positive performance for the quarter was driven by the revaluation of our largest position, Crew Energy, which was up +70% in the quarter on the news it would be acquired by Tourmaline Oil. A breakdown of Equinox Partners exposures can be found here . Crew Energy Investment Post-Mortem On October 1st, Tourmaline Oil acquired Crew Energy bringing a decade-long Equinox Partners’ investment to a successful conclusion. Crew transacted for $1.15 billion USD, which included $960MM USD in Tourmaline shares and $190MM USD of assumed debt. The 72% premium Tourmaline paid resulted in an 11.6% IRR on our investment. This IRR, however, understates the positive impact Crew has had on our performance in recent years. Since we upsized our investment in Crew in the spring of 2020, Crew has been the most significant driver of our fund’s returns. Over the entire life of the investment, Crew contributed a cumulative +139% to our fund’s performance. Accordingly, we felt an investment review is in order. Attracted by Crew Energy’s low-cost and long-lived natural gas reserves in British Columbia, we first invested in December of 2014. At the time of our initial purchase, the Canadian natural gas strip averaged CAD $3.75. If strip prices held, Crew would be able to grow its production at 20%+ per year for a decade with internally generated cash flow. While our thesis about the quality of Crew’s assets was accurate, our assumptions about natural gas prices in North America proved too optimistic. The North American natural benchmark, Henry Hub, averaged just USD $3.09 over the past decade, and the Western Canada benchmark, AECO, fared even worse averaging CAD $2.59. 
By Kieran Brennan July 24, 2024
Dear Partners and Friends, PERFORMANCE Equinox Partners Precious Metals Fund, L.P. rose +2.1% in the second quarter, and is up +7.7% for the 2024 year-to-date through the end of June. Our portfolio of producing gold companies have been the primary drivers of contribution to return, while the early stage explorers and developers have traded down despite the rising metals price. A breakdown of Equinox Partners Precious Metals Fund's exposures can be found here . Gold Miners vs. Gold
More Posts
Share by: