Equinox Partners, L.P. - Q3 2018 Letter
Dear Partners and Friends,
PERFORMANCE & PORTFOLIO
Equinox Partners declined -10.1% in the third quarter of 2018. Through October 31, the fund was down -32.6% for the year to date.
As of October 31, our operating companies were trading at 10.7x estimated ’19 earnings, our mining companies at 4.1x estimated ’19 cash flow, and our energy companies at 4.7x estimated ’19 cash flow. During the third quarter, we purchased two companies in Turkey and sold a global ship brokering company and an Eastern European bank.
Most since 1999
Equinox is on track to post its worst result in 24 years. With 25 of our 30 long equity positions down for the year to date, equity markets increasingly remind us of 1999 when we purchased shares in R.J. Reynolds at ~2.5x after-tax, cash earnings. At the time, our investors found it hard to believe that R.J. Reynolds could trade at a ~40% free cash flow yield at the end of a massive, multi-year bull market. But, it did. The tech boom of the late 90s bred indifference to high-quality businesses that weren’t part of the mania.
It was not just R.J. Reynold’s that was cheap in 1999; our entire portfolio was as hated. Oil traded at a low of $9.68 a barrel, gold traded at a low of $253 per ounce, and emerging markets were coming off a 57% peak-to-trough decline in USD terms. Investors simply could not fathom why they would want to own energy, gold, or emerging markets when they could own the NASDAQ 100 index fund that not only represented the future but also appreciated every year.
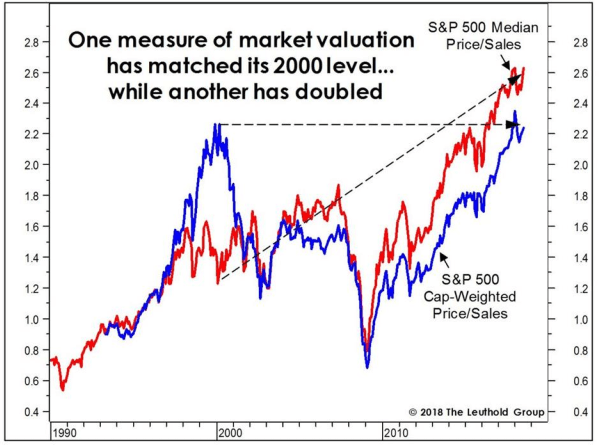
As it turned out, investors’ confidence in the future was mostly justified but their confidence in the predictability of the future was wildly misplaced. Technological change did generate enormous winners, like Amazon, that would soon shrug off their turn-of-the-century correction. But, for every Amazon, there were several tech companies that would never again come close to their peak valuation. With the stock market more overvalued today than it was in 1999 by some measures (see graph), we suspect that another brutal sorting process is not far off. As in the past, some of today’s high flyers will undoubtedly be more valuable in a decade, but some of today’s highly-regarded companies will be worth less and some worthless.
There are, of course, enormous structural differences between 2018 and 1999. Most obviously, it is not at all clear that the Federal Reserve can once again cut rates and induce a debt-fueled boom as they did when the tech bubble burst in 2000. Less obviously, but perhaps more importantly, it is also not clear that the world’s largest economies will once again choose to work together to stave off a global downturn. In the past, this cooperation entailed unlimited swap lines from the Fed, a collective willingness to not politicize large changes in currency cross rates, and the coordinated leasing and selling of gold.
If a steep decline in financial assets were to happen today, such coordinated action amongst the world’s leading economies would be much harder, if not impossible, to muster. In fact, the last time we endured a financial downturn in the context of such palpable international tensions was the late 1960s. Not coincidently, that was also the last time America ran a series of sizable, late-cycle fiscal deficits during a period of economic growth and low unemployment.
The breakdown of the London Gold Pool in March 1968 was the clearest sign that the financial status quo would not be preserved. Rather than continuing to lend and sell gold as they had in the past, Pool members were actively redomiciling gold and adding to their reserves as their faith in the sustainability of the Bretton Woods system waned. After the British government was forced to suspend the London gold market on March 15, 1968 due to massive withdrawals, the Bretton Woods System limped on for another three years, but the unwillingness of the world’s leading economies to cooperate eventually led to the onset of a very dramatic bull market in gold in 1971.
While gold clearly lacks the monetary centrality it had in the Bretton Woods era, the physical dynamics of the gold market remain an important potential flash point when relations amongst countries deteriorate. Gold is a monetary insurance policy that countries buy more of when their faith in the international financial system flags. With this in mind, it is interesting to note that in 2009 central banks became uncoordinated net purchasers of gold for the first time in over forty years, and that the number of countries purchasing gold has increased meaningfully since then. From Hungry to Poland, to Russia, to India, and China, the pattern of behavior is the opposite of what we witnessed at the turn of the century and very similar to the behavior of the late ‘60s.
In the early 1970s, the unmoored gold price quickly unsettled other commodity markets, most significantly the oil market. Here is where our loose comparison with the late ’60s fails, and we are, consequently, much less bullish on oil prices than we are on the price of gold. A rising gold price today simply does not imply the obvious devaluation of the dollar as it did in the ‘70s. So, while we believe that there should be more of a political premium in the oil price given the rise in geo-political tensions, we do not expect oil prices to follow gold prices upward in the short term.
Not only are gold and energy companies not anticipating an upturn in the price of gold and oil, but the companies are trading at ever-more depressed valuations. The gold miner indices are off ~80% from their 2011 peaks and trading at 15-year lows, while the U.S. and Canadian E&P indices are off 56% and 65% respectively from their mid-2014 peak, and trading at 8-year lows. As value investors, we have become increasingly optimistic about the prospects of our gold miners and E&P companies as their valuations compress. To properly communicate this enthusiasm, we thought it would be useful to highlight two of our current holdings, that while in very different businesses, we believe offer a similar investment opportunity to RJR in 1999.
Dundee precious metals
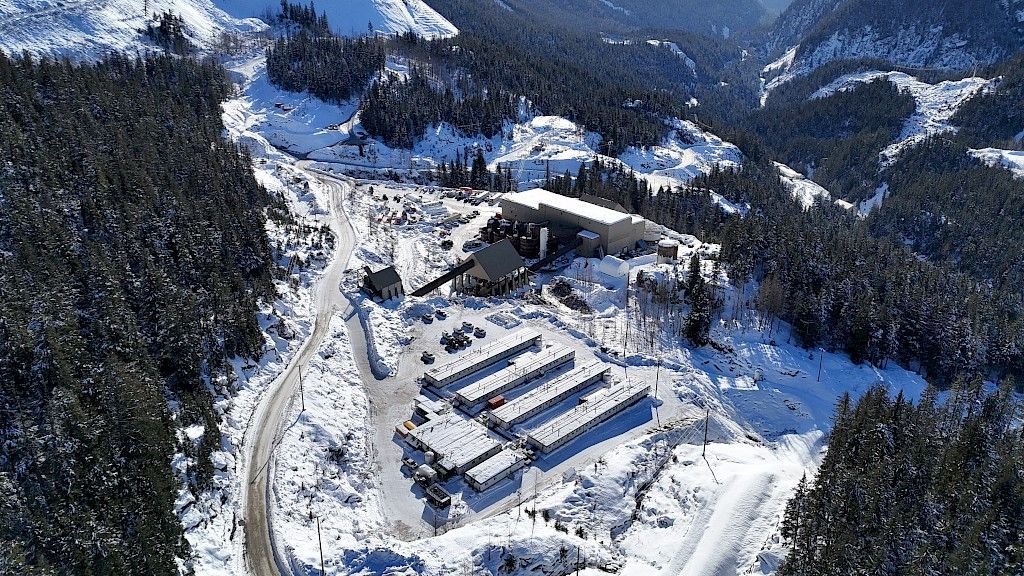
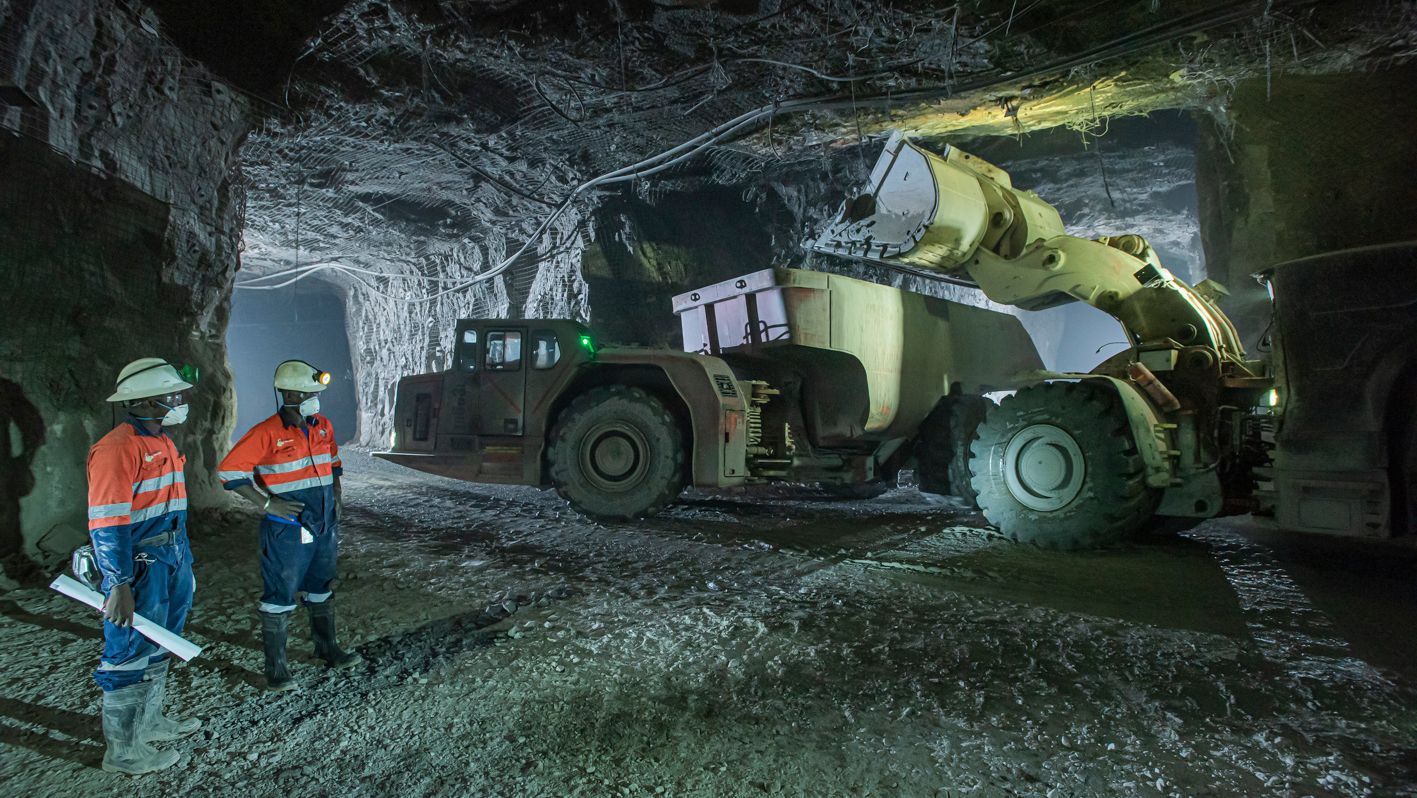
With its second mine in commissioning this December and no significant capital investment obligations going forward, Dundee is poised to generate $150 million USD in free cash flow per year on average for the next five years. With a market capitalization of $470 million, Dundee trades at a free cash flow yield of 32%. Assuming no multiple expansion, no return on exploration investment, and the deployment of the company’s free cash flow evenly amongst dividends, share repurchases, and exploration, the company would yield 10.6% and shrink its shares outstanding by 10.6% per year. We have no assurance that the board will take this path, but management did make it clear on their most recent quarterly conference call that they are comparing all new investment opportunities against the incredible opportunity to reinvest capital back into their own shares. That’s a 32% current free cash flow hurdle against which new investments must compete for capital.
With its second mine in commissioning this December and no significant capital investment obligations going forward, Dundee is poised to generate $150 million USD in free cash flow per year on average for the next five years. With a market capitalization of $470 million, Dundee trades at a free cash flow yield of 32%. Assuming no multiple expansion, no return on exploration investment, and the deployment of the company’s free cash flow evenly amongst dividends, share repurchases, and exploration, the company would yield 10.6% and shrink its shares outstanding by 10.6% per year. We have no assurance that the board will take this path, but management did make it clear on their most recent quarterly conference call that they are comparing all new investment opportunities against the incredible opportunity to reinvest capital back into their own shares. That’s a 32% current free cash flow hurdle against which new investments must compete for capital.
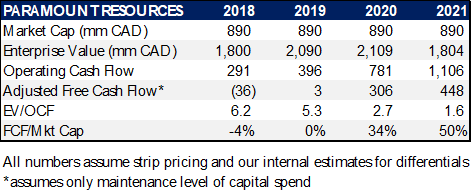
With double digit production growth and rising mix of higher value liquids, Paramount is poised to grow cash flow from $290 million this year to over $1 billion by 2021. Given Paramount’s past operational disappointments and the current energy pricing differentials in Western Canada, the market remains skeptical of these figures and is pricing Paramount’s stock accordingly. We, however, think there is good reason to be optimistic. First, we believe that the worst of the operational miscues are behind them. By partnering with Keyera, one of the top midstream companies in Canada, Paramount has radically reduced their execution risk. In fact, all of Paramount’s incremental production growth for 2019 will be delivered to a plant Keyera is building. Second, with respect to condensate differentials, given that Canada is still a sizable net importer of condensate, we expect the differentials with the US to close quickly.
Oragization
In September, Arthur Melkonian replaced Massimo Devellis as COO, and our CFO, Denise Alejo, assumed CCO duties. Arthur, who ran our middle office for the past seven years, has hit the ground running and already identified some operational efficiencies. We also recruited two new mining analysts to replace Marco Locascio. Stephen Saroki, a past summer intern, joined us in October, and we expect to add a Canadian mining specialist in January.
Both Massimo and Marco were long-standing partners, and we wish them the best in their new endeavors. Massimo has taken on an operations role at a multi-family office in New York, and Marco is now running a junior diamond mining company.
Sincerely,
Sean Fieler Daniel Gittes
[1] Sector exposures shown as a percentage of 10.31.18 pre-redemption AUM. Performance contribution derived in US dollars, gross of fees and fund expenses. Interest rate swaps notional value and P&L included in Fixed Income. P&L on cash excluded from the table as are market value exposures for derivatives. Unless otherwise noted, all company data derived from internal analysis, company presentations, or Bloomberg. All values as of 10.31.18 unless otherwise noted.
[2] E.g., Board of Governors of the Federal Reserve System, 2001 Annual Report, pp 4, 113; “Central Bank Liquidity Swaps” <https://www.federalreserve.gov/monetarypolicy/bst_liquidityswaps.htm>.
[3] E.g., Greenspan’s comment that central banks “stand ready to lease gold in increasing quantities should the price rise” <https://www.federalreserve.gov/boarddocs/testimony/1998/19980724.htm>; and BIS economist William R. White’s comment, in his opening remarks to the 4th BIS Annual Conference held in February 2006, that one of the ultimate objectives of central bank cooperation is “the provision of international credits and joint efforts to influence asset prices (especially gold and foreign exchange) in circumstances where this might be thought useful” <https://www.bis.org/publ/bppdf/bispap27.pdf>.
[4] In 1968, the US federal government ran a 2.7% budget deficit while unemployment trended downward to 3.4% and US GDP grew 9.8% (source: FRED data)
[5] Central banks became net sellers of gold in 1966 and, by 2008, had sold 28% of the collective gold reserves they held in 1965. Apart from 1998, there was no year between 1966 and 2008 in which central banks collectively increased their gold reserves by more than 1.5%. (Source: World Gold Council data, <https://bit.ly/2PsnLU3>, <https://bit.ly/2K2tBFJ>)
[6] Hungary increased its gold reserves by 10x in October <https://bloom.bg/2CNwdXa>, while Poland’s purchases of gold in July and August are their first since 1998 and, indeed, the first gold purchase by a European central bank this century <https://on.ft.com/2xHXVR9>. Russia has been steadily buying gold while at the same time dramatically reducing its exposure to US debt. This year, India has purchased gold for the first time since 2009 <https://bit.ly/2K0gipj>.
[7] According to World Gold Council data, central banks were net collective sellers of gold from 2000 until 2009 <https://bit.ly/2Dng0HV>.


Equinox Partners Investment Management, LLC | Information as of 12.31.24 unless noted | *SEC registration does not imply a certain level of skill or training
Equinox Partners Investment Management, LLC | Site by Fix8


